Last Updated on January 30, 2026 1:35 am by BIZNAMA NEWS
FIRST ADVANCE ESTIMATE PROJECTS REAL GDP GROWTH AND GVA GROWTH FOR FY26 TO 7.4 AND 7.3 PER CENT RESPECTIVELY
POTENTIAL GROWTH FOR INDIA ESTIMATED AT AROUND 7 PER CENT, WHILE REAL GDP GROWTH FOR FY27 PROJECTED AT 6.8-7.2 PER CENT
CENTRE’S REVENUE RECEIPTS ROSE TO 9.2% OF GDP IN FY25 (PA)
GNPAs REACH MULTI-DECADAL LOW OF 2.2%IN SEPTEMBER 2025
55.02 CRORE BANK ACCOUNTS OPENED AS OF MARCH 2025 UNDER PMJDY, WITH 36.63 CRORE IN RURAL AND SEMI-URBAN AREAS
NUMBER OF UNIQUE INVESTORS CROSS THE 12-CRORE MARK IN SEPTEMBER 2025, WITH NEARLY 25 PER CENT BEING WOMEN
INDIA’S SHARE OF GLOBAL MERCHANDISE EXPORTS NEARLY DOUBLES FROM 1% TO 1.8% BETWEEN 2005 AND 2024
SERVICES EXPORTS TOUCH AN ALL-TIME HIGH OF USD 387.6 BILLION IN FY25, GROWING BY 13.6%
INDIA REMAINES THE WORLD’S LARGEST RECIPIENT OF REMITTANCES, WITH INFLOWS REACHING USD 135.4 BILLION IN FY25
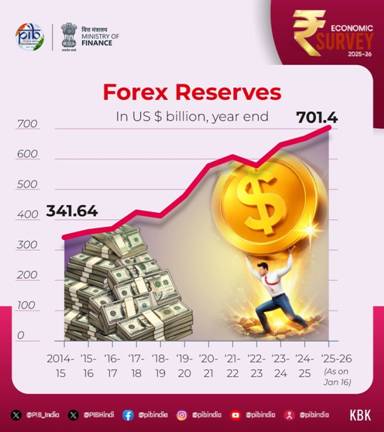
INDIA’S FOREIGN EXCHANGE RESERVES INCREASE TO USD 701.4 BILLION AS OF 16TH JANUARY 2026, PROVIDING COVER FOR 11 MONTHS IMPORTS AND 94% OF EXTERNAL DEBT
DOMESTIC INFLATION AVERAGED 1.7 PER CENT FOR APRIL-DECEMBER, 2025
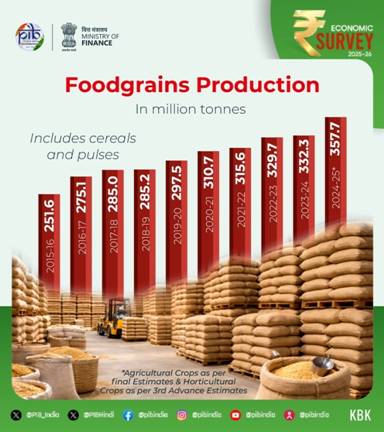
INDIA’S FOODGRAIN PRODUCTION IS ESTIMATED TO HAVE REACHED 3577.3 LAKH METRIC TONNES (LMT) IN AGRICULTURE YEAR (AY) 2024–25, AN INCREASE OF 254.3 LMT OVER THE PREVIOUS YEAR
MORE THAN ₹4.09 LAKH CRORE HAS BEEN RELEASED TO ELIGIBLE FARMERS UNDER PM-KISAN SINCE ITS INCEPTION
VIKSIT BHARAT-GRAMG IS A COMPREHENSIVE STATUATORY OVERHAUL OF MGNEREGS ALIGNING RURAL EMPLOYMENT WITH LONG-TERM VISION OF VIKSIT BHARAT 2047
MANUFACTURING GVA GROW BY 7.72% IN Q1 AND 9.13% IN Q2 OF FY26, REFLECTING STRUCTURAL RECOVERY
PRODUCTION LINKED INCENTIVE (PLI) SCHEMES ACROSS 14 SECTORS HAVE ATTRACTED OVER ₹2.0 LAKH CRORE OF ACTUAL INVESTMENT, GENERATING INCREMENTAL PRODUCTION/SALES EXCEEDING ₹18.7 LAKH CRORE AND OVER 12.6 LAKH JOBS AS OF SEPTEMBER 2025
INDIA SEMICONDUCTOR MISSION HAS ADVANCED DOMESTIC CAPABILITIES, WITH 10 PROJECTS OF ABOUT ₹1.60 LAKH CRORE OF INVESTMENT
HIGH-SPEED CORRIDORS INCREASE NEARLY TEN-FOLD-FROM 550 KM (FY14) TO 5,364 KM (FY26, UP TO DECEMBER 2025); 3,500 KM OF RAILWAY ADDED IN FY26
INDIA IS THE WORLD’S 3RDLARGEST DOMESTIC AVIATION MARKET, WITH THE NUMBER OF AIRPORTS INCREASING FROM 74 IN 2014 TO 164 IN 2025
HISTORIC TURNAROUND FOR DISCOMS; RECORDING A POSITIVE PAT OF ₹2,701 CRORE IN FY25 FOR THE FIRST TIME
INDIA RANKS 3RD GLOBALLY IN OVERALL RENEWABLE ENERGY AND INSTALLED SOLAR CAPACITY
INDIA BECOMES THE FOURTH NATION TO ACHIEVE AUTONOMOUS SATELLITE DOCKING (SPADEX) CAPABILITY
GROSS ENROLMENT RATIO (GER) STANDS AT 90.9, 90.3 AND 78.7 AT THE PRIMARY, UPPER PRIMARYAND SECONDARY STAGES
INDIA NOW HAS 23 IITS, 21 IIMS, AND 20 AIIMS, ALONGSIDE THE ESTABLISHMENT OF TWO INTERNATIONAL IIT CAMPUSES IN ZANZIBAR AND ABU DHABI
INDIA ACCELERATED MATERNAL AND CHILD MORTALITY REDUCTION SINCE 1990, OUTPACING GLOBAL AVERAGES
AS OF JANUARY 2026, THE E-SHRAM PORTAL HAS SUCCESSFULLY REGISTERED OVER 31 CRORE UNORGANISED WORKERS, 54% BEING WOMEN
VACANCIES MOBILISED IN THE NATIONAL CAREER SERVICE PORTAL EXCEEDED 2.8 CRORE IN FY25 AND HAVE ALREADY CROSSED 2.3 CRORE BY SEPTEMBER FY26.
MULTIDIMENSIONAL POVERTY INDEX (MPI) AS MEASURED BY NITI AAYOG SHOWS A DECLINE FROM 55.3% IN 2005-06 TO 11.28% IN 2022-23
SURVEY PROPOSES DISCIPLINED SWADESHI FOR STRATEGIC RESILIENCE: A CALIBRATED THREE-TIERED STRATEGY THAT BUILDS CRITICAL CAPABILITIES, REDUCES INPUT COSTS, STRENGTHENS ADVANCED MANUFACTURING, AND PROGRESSES FROM SELF-RELIANCE TO STRATEGIC INDISPENSABILITY
Union Minister for Finance and Corporate Affairs Smt. Nirmala Sitharaman tabled the Economic Survey 2025-26 in Parliament today. The highlights of the Economic Survey are as follows.
STATE OF THE ECONOMY
- The global environment remains fragile, with growth holding up better than expected but risks elevated amid intensifying geopolitical tensions, trade fragmentation and financial vulnerabilities. The impact of these shocks may still surface with a lag.
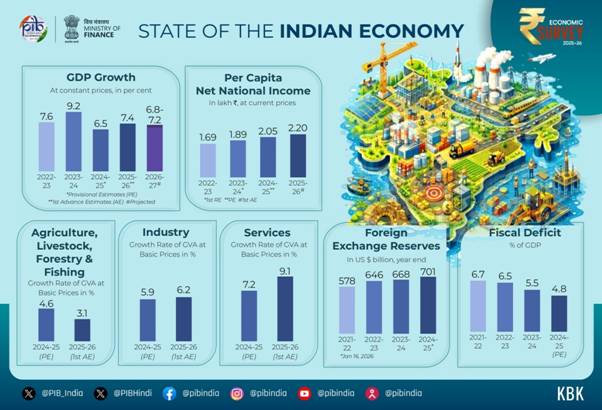
- Against this backdrop, India’s performance stands out. The First Advance Estimates place FY26 real GDP growth at 7.4 per cent and GVA growth at 7.3 per cent, reaffirming India’s status as the fastest-growing major economy for the fourth consecutive year.
- Private Final Consumption Expenditure grew by 7.0 per cent in FY26, reaching 61.5 per cent of GDP, the highest since 2012 (FY23 also recorded 61.5 per cent share). This growth is supported by low inflation, stable employment, and increasing real purchasing power. Strong agricultural performance has bolstered rural consumption, while improvements in urban consumption, aided by tax rationalisation, indicate broad-based demand momentum.
- Investment activity strengthened in FY26, with Gross Fixed Capital Formation growing by 7.8 per cent and its share remaining steady at 30 per cent of GDP. This momentum was buoyed by sustained public capital expenditure and a revival in private investment activity, as evident from corporate announcements.
- On the supply side, services remain the main driver of growth. In the first half of FY26, the Gross Value Added (GVA) for services increased by 9.3 per cent, with an estimated 9.1 per cent growth for the entire fiscal year. This trend indicates a broad-based expansion across the sector.
FISCAL DEVELOPMENTS: ANCHORING STABILITY THROUGH CREDIBLE CONSOLIDATION
- The government’s prudent fiscal management has strengthened credibility and reinforced confidence in India’s macroeconomic and fiscal framework. This led to three sovereign credit rating upgrades in 2025 – by Morningstar DBRS, S&P Global Ratings, and Rating and Investment Information (R&I), Inc.
- Centre’s revenue receipts strengthened from an average of about 8.5 per cent of GDP in FY16–FY20 to 9.2% of GDP in FY25 (PA). This improvement was driven by buoyant non-corporate tax collections, which rose from about 2.4 per cent of GDP pre-pandemic to around 3.3 per cent post-pandemic.
- The direct tax base expanded steadily, with income tax returns filed increasing from 6.9 crore in FY22 to 9.2 crore in FY25. Higher return filings reflect improved compliance, greater use of technology in tax administration, and a growing number of individuals entering the tax net as their incomes rise.
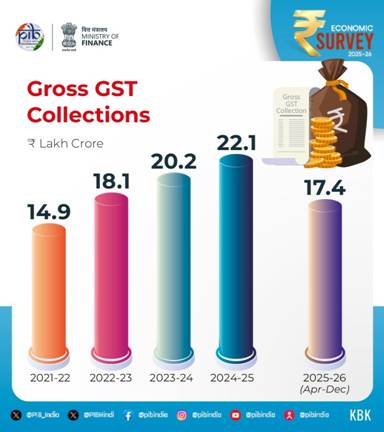
- Gross GST collections during April–December 2025 stood at ₹17.4 lakh crore, registering a year-on-year growth of 6.7 per cent. GST revenue growth is broadly aligned with prevailing nominal GDP growth conditions. In parallel, high-frequency indicators suggest robust transaction volumes, with cumulative e-way bill volumes during April-December 2025 growing by 21 per cent YoY.
- The effective capital expenditure of the Central government rose from an average of 2.7 per cent of GDP in the pre-pandemic period to about 3.9 per cent post-pandemic, and to a higher 4 per cent of GDP in FY25.
- Through Special Assistance to States for Capital Expenditure (SASCI), the Centre has incentivised States to maintain capital spending at around 2.4 per cent of GDP in FY25.
- The combined fiscal deficit of State Governments stayed broadly stable at around 2.8 per cent of GDP in the post-pandemic period, similar to pre-pandemic levels, but has edged up in recent years to 3.2 per cent in FY25, reflecting emerging pressures on State finances.
- India reduced its general government debt-to-GDP ratio by about 7.1 percentage points since 2020, even while maintaining high public investment.
MONETARY MANAGEMENT AND FINANCIAL INTERMEDIATION: REFINING THE REGULATORY TOUCH
Monetary aspects
- India’s monetary and financial sectors have exhibited robust performance in FY26 (April-December 2025), underpinned by strategic policy actions and structural resilience across financial intermediation channels.
Banking sector performance
- A significant improvement has been observed in the asset quality of scheduled commercial banks (SCBs), as evidenced by their GNPA ratio standing at 2.2% in September 2025 and net NPA ratio at 0.5% in September 2025, having reached a multi-decadal low level and record low level, respectively.
- As of 31 December 2025, the year-on-year growth in outstanding credit by SCBs increased to 14.5 per cent compared to 11.2 per cent in December 2024.
Financial inclusion
- The Pradhan Mantri Jan Dhan Yojana (PMJDY), launched in 2014, has opened 55.02 crore accounts as of March 2025, with 36.63 crore in rural and semi-urban areas, establishing foundational savings and transaction infrastructure for previously unbanked populations.
- The Stand-Up India Scheme offers bank loans ranging from ₹10 lakh to ₹1 crore to SC, ST, and women entrepreneurs for establishing greenfield enterprises.
- The PM Street Vendor’s Aatmanirbhar Nidhi (PM SVANidhi) scheme is providing collateral-free working capital loans to street vendors.
- The Pradhan Mantri Mudra Yojana (PMMY) is financing micro and small enterprises in manufacturing, trading, services, and allied agricultural activities. By October 2025, the scheme had disbursed over ₹36.18 lakh crore across 55.45 crore loan accounts.
- During FY26 (till December 2025), 235 lakh of demat accounts were added, pushing the total count beyond 21.6 crore. A key milestone was the crossing of the 12-crore mark for unique investors in September 2025, with nearly a fourth of them being women.
- The mutual fund industry also expanded, with 5.9 crore unique investors as of the end of December 2025, of which 3.5 crore (as of November 2025) were from non-tier-I and tier-II cities, underscoring the diffusion of financial participation beyond traditional urban centres.
- India’s first international financial services centre at GIFT City is creating an enabling ecosystem to attract and channel global capital.
Other aspects of the financial sector
Outlook for the sector
- The systemic rise in regulatory quality has received international validation through the Financial Sector Assessment Program (FSAP) conducted jointly by the IMF and World Bank in 2025. Both reports noted an increasingly resilient, diversified, and inclusive financial system, with total financial sector assets at nearly 187 per cent of GDP in CY 2024 and capital markets expanding from 144 per cent of GDP in CY 2017 to 175 per cent in CY 2024. The assessments found that banks and NBFCs possess adequate capital buffers even under severe stress scenarios.
EXTERNAL SECTOR: PLAYING THE LONG GAME
- Between CY 2005 & CY 2024, India’s share of global merchandise exports nearly doubled from 1 per cent to 1.8 per cent, while its share of global commercial services exports more than doubled from 2 per cent to 4.3 per cent.
- According to UNCTAD’s Trade and Development Report 2025, India ranked among the leading economies in trade partner diversification, ranking third in the Global South and recording a trade diversity score higher than all Global North economies.
- India’s total exports reached a record USD 825.3 billion in FY25, registering a 6.1 per cent year-on-year growth, driven primarily by robust growth in services exports.
- Non-petroleum exports reached a historic high of USD 374.3 billion in FY25, while non-petroleum, non-gems and jewellery exports constituted nearly four-fifths of aggregate merchandise exports.
- Services exports touched an all-time high of USD 387.6 billion in FY25, growing by 13.6 per cent, reinforcing India’s position as a global hub for technology and business services.
- India’s current account deficit remained moderate, supported by strong net inflows from services exports and remittances that offset the merchandise trade deficit. In Q2 FY26, India’s CAD, at around 1.3 per cent of GDP, compared favourably with several other major economies.
- India remained the world’s largest recipient of remittances, with inflows reaching USD 135.4 billion in FY25, supporting stability in the external account. The share of remittances from advanced economies increased, reflecting a growing contribution from skilled and professional workers.
- India’s foreign exchange reserves increased to USD 701.4 billion as of 16 January 2026, providing import cover of about 11 months and covering over 94 per cent of external debt, thereby strengthening resilience against external volatility.
- Amid a subdued global investment environment, India continued to attract substantial foreign direct investment, with gross FDI inflows reaching USD 64.7 billion during April-November 2025.
- India ranked fourth globally in Greenfield investment announcements in 2024, with over 1,000 projects and emerged as the largest destination for Greenfield digital investments between 2020-24.
INFLATION: TAMED AND ANCHORED
- India recorded the lowest inflation rate since the beginning of the CPI series, with April-Dec ‘25 average headline inflation coming in at 1.7%. The moderation in retail inflation can primarily be attributed to the general disinflationary trend in food and fuel prices, which together account for 52.7 per cent of India’s Consumer Price Index (CPI) basket.
- Notably, among major Emerging Markets & Developing Economies (EMDEs), India has recorded one of the sharpest declines in headline inflation in 2025 over 2024, amounting to about 1.8 percentage points.
AGRICULTURE AND FOOD MANAGEMENT
- Between FY15 and FY24, the livestock sector witnessed strong growth, with GVA rising by nearly 195 per cent. The fisheries sector has also performed well, with fish production increasing by more than 140 per cent during 2014-2024, compared to the increase from 2004-14.
- With a good monsoon season, India’s foodgrain production is estimated to have reached 3,577.3 lakh metric tonnes (LMT) in Agriculture Year (AY) 2024–25, an increase of 254.3 LMT over the previous year. This growth has been driven by higher output of rice, wheat, maize and coarse cereals (Shree Anna).
- Despite rising foodgrain output, horticulture, accounting for about 33 per cent of agricultural GVA, has emerged as a key driver of agricultural growth. In 2024-25, horticulture production reached 362.08 million tonnes (MT), surpassing the estimated food grain production of 357.73 MT.
- To improve efficiency in agricultural marketing and infrastructure, the Government is implementing the Agriculture Marketing Infrastructure (AMI) sub-scheme under ISAM and the Agriculture Infrastructure Fund (AIF) to strengthen farm-gate facilities and encourage private sector participation. Price discovery has been enhanced through the e-NAM Scheme, which, as of 31 December 2025, has onboarded about 1.79 crore farmers, 2.72 crore traders and 4,698 FPOs, covering 1,522 mandis across 23 States and 4 UTs.
- Farmers’ incomes are supported through assured MSP for mandated crops and PM-KISAN income transfers. In addition, the PM Kisan Maandhan Yojana (PMKMY) provides pension support, strengthening farmers’ income security and social protection. Since its inception, under PM-KISAN, more than ₹4.09 lakh crore has been released to eligible farmers in 21 instalments. Under PMKMY, 24.92 lakh farmers are enrolled as of 31 December 2025.
SERVICES: FROM STABILITY TO NEW FRONTIERS
- Services’ share in GDP rose to 53.6 per cent in H1 FY26; Services’ share in GVA stood at the highest ever – 56.4 per cent – as per FAE of FY26 which shows the rising weight of modern, tradable and digitally delivered services.
- India is the world’s seventh-largest exporter of services, with its share in global services trade more than doubling from 2 per cent in 2005 to 4.3 per cent in 2024.
- The services sector continues to be the largest recipient of foreign direct investment inflows, accounting for an average of 80.2 per cent of total FDI during FY23-FY25, up from 77.7 per cent in the pre-pandemic period (FY16-FY20).
INDUSTRY’S NEXT LEAP: STRUCTURAL TRANSFORMATION AND GLOBAL INTEGRATION
- Industrial activity strengthened in FY26, with Industry GVA growing 7.0% (real terms) in H1, despite subdued and persistent global headwinds.
- Manufacturing growth accelerated, with GVA expanding 7.72% in Q1 and 9.13% in Q2 FY26, reflecting structural recovery.
- Production Linked Incentive (PLI) Schemes across 14 sectors have attracted over ₹2.0 lakh crore of actual investment, generating incremental production/sales exceeding ₹18.7 lakh crore and over 12.6 lakh jobs as of September 2025.
- India’s innovation performance has strengthened steadily, with its Global Innovation Index rank improving to 38th in 2025 from 66th in 2019.
- The India Semiconductor Mission has advanced domestic capabilities, with 10 semiconductor manufacturing and packaging projects approved across 6 States, involving about ₹1.60 lakh crore of investment.
INVESTMENT AND INFRASTRUCTURE: STRENGTHENING CONNECTIVITY, CAPACITY AND COMPETITIVENESS
- The Government of India’s capital expenditure has increased nearly 4.2 times, from ₹2.63 lakhcrore in FY18 to ₹11.21 lakh crore in FY26 (BE), while effective capital expenditure in FY26 (BE) is ₹15.48 lakh crore, positioning infrastructure as a key growth driver.
- National highway infrastructure expanded substantially, with the NH network growing by about 60 per cent from 91,287 km (FY14) to 1,46,572 km (FY26, up to December), and operational High-Speed Corridors increasing nearly ten-fold—from 550 km (FY14) to 5,364 km (FY26, up to December).
- Railway infrastructure continued to expand, with the rail network reaching 69,439 route km as of March 2025, a targeted addition of 3,500 km in FY26, and 99.1 per cent electrification achieved by October 2025.
- India has emerged as the world’s third-largest domestic aviation market, with the number of airports increasing from 74 in 2014 to 164 in 2025.
- The power sector recorded sustained capacity expansion, with installed capacity rising 11.6 per cent (y-o-y) to 509.74 GW as of November 2025, and the demand–supply gap declined from 4.2 per cent in FY14 to nil by November 2025
- Power sector reforms delivered a historic turnaround, with DISCOMs recording a positive Profit after Tax (PAT) of ₹2,701 crore in FY25 for the first time, alongside a reduction in AT&C losses from 22.62 per cent (FY14) to 15.04 per cent (FY25). Renewable energy constitutes around 49.83 per cent of total power generation capacity as of November 2025, with India ranking third globally in overall RE and installed solar capacity.
- Tele-density reached 86.76 per cent, and 5G services are now available in 99.9 per cent of districts in the country.
- Over 81 per cent of rural households have access to clean tap water under the Jal Jeevan Mission, as of October 2025.
- Space infrastructure strengthened, with India becoming the fourth nation to achieve autonomous satellite docking (SpaDeX), alongside expanded indigenous missions and increased private-sector participation.
ENVIRONMENT AND CLIMATE CHANGE: BUILDING A RESILIENT, COMPETITIVE AND DEVELOPMENT-DRIVEN INDIA
- During 2025-26 (up to 31st December 2025), a total of 38.61 GW of renewable energy capacity has been installed in the country, which includes 30.16 GW of solar power, 4.47 GW of wind power, 0.03 GW of Bio-Power and 3.24 GW of hydro power
EDUCATION AND HEALTH: WHAT WORKS AND WHAT’S NEXT
- India today operates one of the world’s largest school systems, serving 24.69 crore students across 14.71 lakh schools, supported by over 1.01 crore teachers (UDISE+ 2024-25).
- India has made notable gains in school enrolment by strengthening infrastructure and teacher capacity, with schemes like Poshan Shakti Nirman and Samagra Shiksha Abhiyan promoting access and equity. Gross Enrolment Ratio (GER) are 90.9 at the primary stage (Grade I to V), 90.3 at the upper primary (Grade VI to VIII), 78.7 at the secondary stage (Grade IX and X) and 58.4 at the higher secondary stage (Grade XI and XII).
Higher education
- The number of higher education institutions (HEIs) has increased from 51,534 in 2014-15 to 70,018 as of June 2025, significantly improving access. This increase is marked by substantial growth in universities and colleges. The number of premier higher education institutions (HEIs) has expanded significantly between 2014-15 and 2024-25. It now stands at 23 IITs, 21 IIMs, and 20 AIIMS, alongside the establishment of two international IIT campuses in Zanzibar and Abu Dhabi.
- Under the NEP, the higher education system has undergone several reforms.
- The National Credit Framework (NCrF), which aims to blend academic and skills-based learning, has been adopted by 170 universities.
- The Academic Bank of Credit covers 2660 institutions, with over 4.6 crore IDs issued, including the generation of 2.2 crore APAAR (Automated Permanent Academic Account Registry) IDs with credits.
- 153 universities have introduced flexible entry-exit pathways and biannual admissions to achieve the NEP target of 50 per cent GER by 2035.
Health
- Since 1990, India has reduced its maternal mortality rate (MMR) by 86 per cent, far exceeding the global average of 48 per cent. A 78 per cent decline in the under-five mortality rate (U5MR) was achieved, surpassing the global reduction of 61 per cent and a 70 per cent decline in the neonatal mortality rate (NMR) compared to 54 per cent globally during 1990-2023.
- The infant mortality rate (IMR) marked a drop of more than 37 per cent over the past decade, declining from 40 deaths per thousand live births in 2013 to 25 in 2023.
EMPLOYMENT AND SKILL DEVELOPMENT: GETTING SKILLING RIGHT
- A total of 56.2 crore people (aged 15 years and above) were employed in Q2 FY26, reflecting a creation of around 8.7 lakh new jobs in Q2 compared to Q1 of FY26.
- The Annual Survey of Industries (ASI), which covers the organised manufacturing sector, results for FY24 highlight the manufacturing sector’s resilience, showing a 6 per cent YoY increase in employment over the previous year. This translates to an addition of over 10 lakh jobs in FY24 compared to FY23.
- The Labour Codes have formally recognised gig and platform workers, expanding social security, welfare funds, and benefit portability.
- As of January 2026, the e-Shram portal has successfully registered over 31 crore unorganised workers; women account for over 54 per cent of total registrants, substantially strengthening the reach of gender-focused welfare schemes.
- The National Career Service (NCS) is a one-stop solution connecting job seekers, employers, training providers with over 59 million registered job seekers and 5.3 million job providers across diverse sectors and mobilising approximately 80 million vacancies.
Skill ecosystem
- The National Scheme for Upgradation of ITIs proposes to upgrade 1,000 government ITIs, including 200 hub ITIs and 800 spoke ITIs, through smart classrooms, modern labs, digital content, and industry-aligned long- and short-term courses.
RURAL DEVELOPMENT AND SOCIAL PROGRESS: FROM PARTICIPATION TO PARTNERSHIPS
- The World Bank has raised the poverty line from USD 2.15 to USD 3.00 a day, adjusted for the purchasing power of money to 2021 prices. According to the revised IPL, India’s poverty rates in 2022-23 were 5.3 per cent for extreme poverty and 23.9 per cent for lower-middle-income poverty.
- The general government’s social services expenditure (SSE) has shown a rising trend since FY22.
- The SSE stands at 7.9% of GDP in FY 2025-26 (BE) against 7.7% in 2024-25 (RE) and 7% in 2023-24.
Health of the rural economy
- As of December 2025, the drone survey under SVAMITVA has been completed in 3.28 lakh villages, against a target of nearly 3.44 lakh villages notified for drone survey. 2.76 crore property cards have been prepared for nearly 1.82 lakh villages. Lead Fertiliser Companies distributed 1,094 drones to SHG Drone Didis in 2023-24 using their own resources, with 500 of these drones provided under the Namo Drone Didi Scheme.
EVOLUTION OF THE AI ECOSYSTEM IN INDIA: THE WAY FORWARD
Smaller, task-specific models deployed across sectors allow innovation to diffuse more evenly, reduce entry barriers for firms, and better fit the diversity of India’s economic landscape. India’s demand for AI is emerging from real-world problems rather than speculative frontier uses. Across healthcare, agriculture, urban management, education, disaster preparedness, and public administration, there is a growing appetite for AI systems that work on local hardware and operate in low-resource settings.
URBANISATION: MAKING INDIA’S CITIES WORK FOR ITS CITIZENS
The Namo Bharat Regional Rapid Transit System illustrates how high-speed regional connectivity can reshape urban and peri-urban labour markets. By sharply reducing travel times between cities and their surrounding regions, such systems expand access to jobs, support polycentric growth, and ease pressure on core metropolitan areas.
FROM IMPORT SUBSTITUTION TO STRATEGIC RESILIENCE AND STRATEGIC INDISPENSABILITY
- ‘Swadeshi’ must be a disciplined strategy, as not all import substitution is either feasible or desirable, a disciplined approach to indigenisation is presented through a three-tiered framework that distinguishes critical vulnerabilities with high strategic urgency, economically feasible capabilities with strategic payoffs, and low strategic urgency or high-cost substitution.
- A National Input Cost Reduction Strategy that treats competitiveness as infrastructure, recognising affordable and reliable inputs.
- A progression from ‘Swadeshi’ to Strategic Resilience to Strategic Indispensability, in which intelligent import substitution invests in national strength and ultimately embeds India in global systems, so that the world moves from “thinking about buying Indian” to “buying Indian without thinking.”